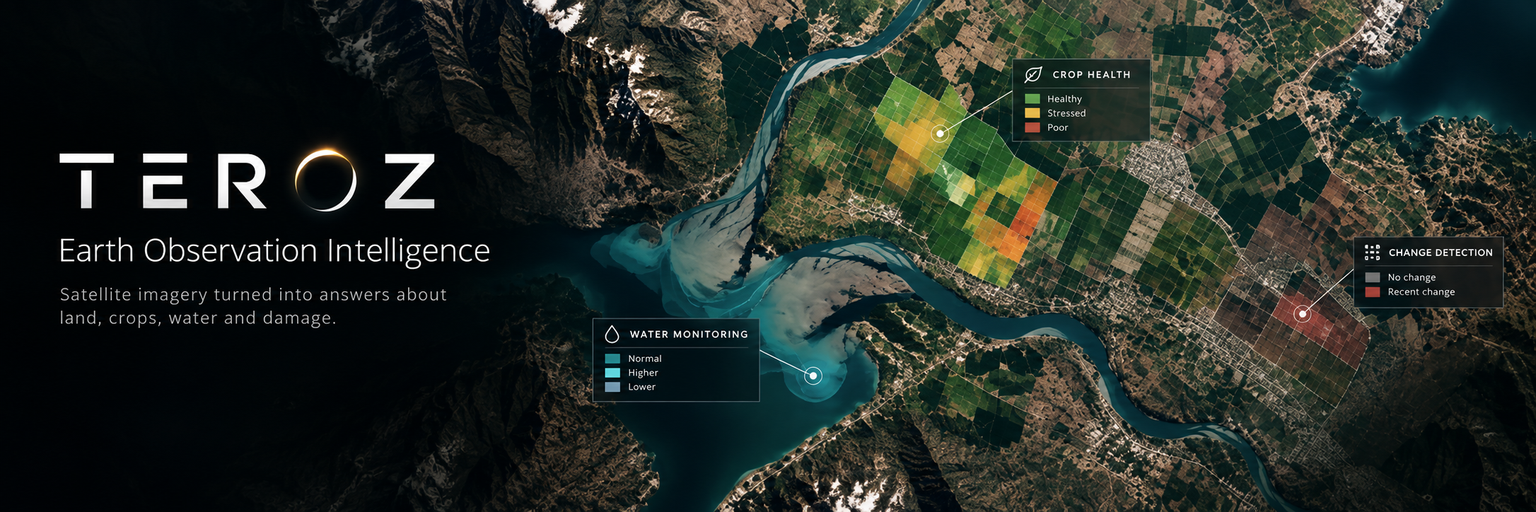
"The ground tells the truth slowly — one field, one visit, one report at a time. From orbit it tells the same truth every week, to anyone who can read the image."
Every season, decisions about land are made from reports that are already out of date. A satellite passes over the same field again and again, and the answer is sitting in those images long before anyone drives out to look.
TEROZ reads satellite imagery and turns it into answers about land, crops, water and damage — at the scale of a farm, a district or a whole country.
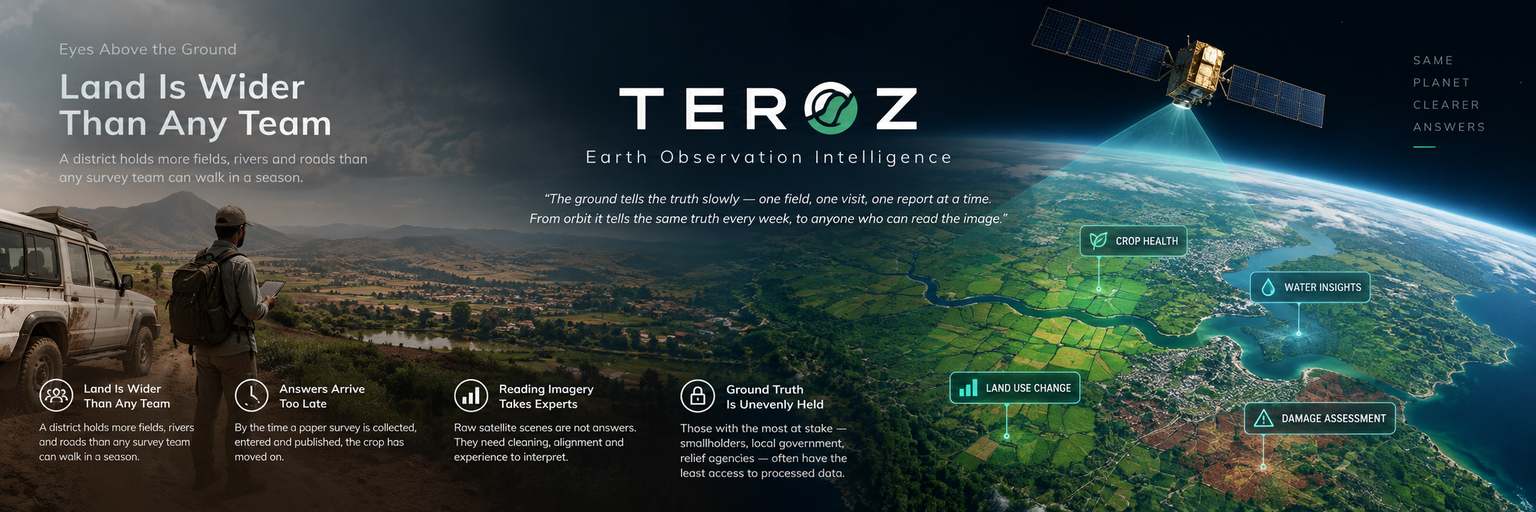
A district holds more fields, rivers and roads than any survey team can walk in a season. What gets checked is whatever lies near a road, and the rest is estimated from memory.
By the time a paper survey is collected, entered and published, the crop has moved on, the water has receded and the decision it was meant to inform has already been made.
Raw satellite scenes are not answers. Someone has to remove cloud, line the scenes up, compare them against last month and know what a change in colour actually means on the ground.
The organisations with the most at stake — smallholders, local government, relief agencies — are usually the ones with the least access to processed Earth observation data.
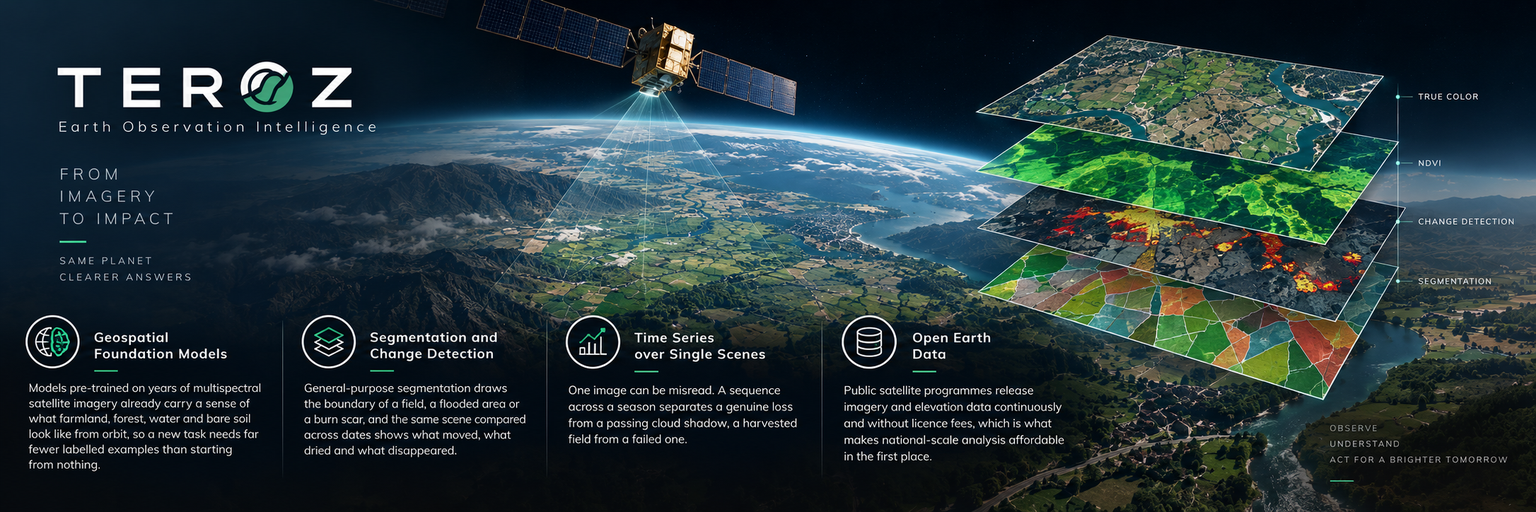
Models pre-trained on years of multispectral satellite imagery already carry a sense of what farmland, forest, water and bare soil look like from orbit, so a new task needs far fewer labelled examples than starting from nothing.
General-purpose segmentation draws the boundary of a field, a flooded area or a burn scar, and the same scene compared across dates shows what moved, what dried and what disappeared.
One image can be misread. A sequence across a season separates a genuine loss from a passing cloud shadow, a harvested field from a failed one.
Public satellite programmes release imagery and elevation data continuously and without licence fees, which is what makes national-scale analysis affordable in the first place.
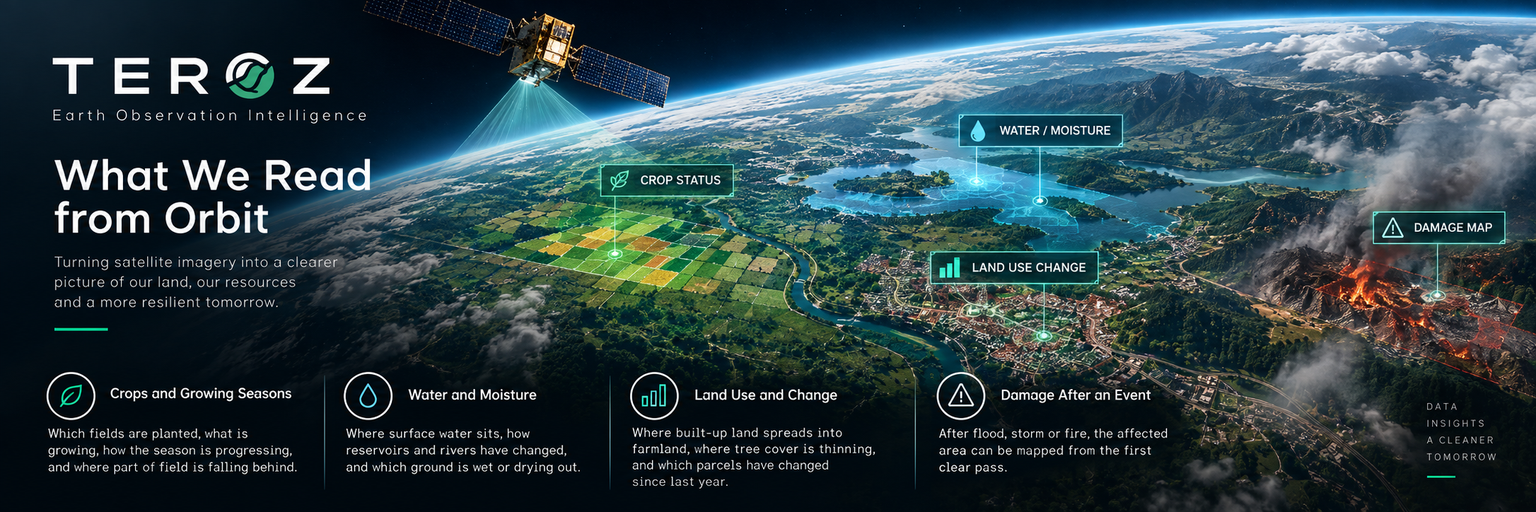
Which fields are planted, roughly what is growing there, how the season is progressing and where a patch is falling behind the rest of the same field.
Where surface water sits, how a reservoir or river has changed since last month, and which ground is holding moisture and which has dried out.
Where built-up land is spreading into farmland, where tree cover is thinning, and which parcels look different from the same week a year ago.
After a flood, storm or fire, the extent of the affected area mapped from the first clear pass — the question relief teams ask first and can rarely answer quickly.
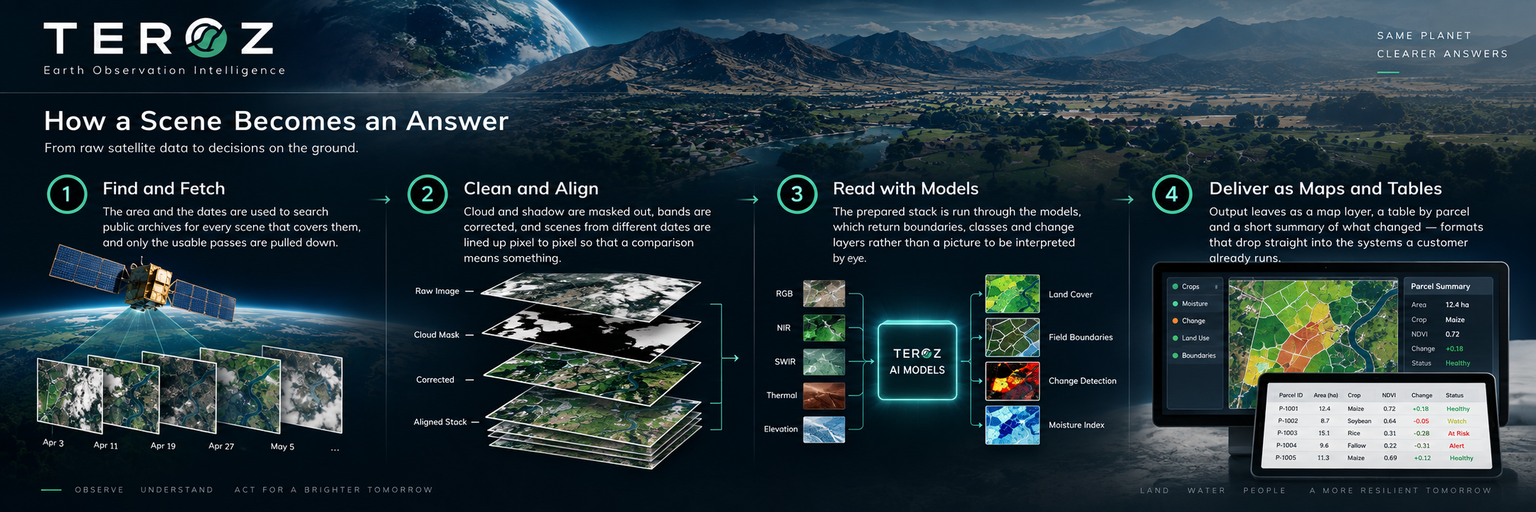
The area and the dates are used to search public archives for every scene that covers them, and only the usable passes are pulled down.
Cloud and shadow are masked out, bands are corrected, and scenes from different dates are lined up pixel to pixel so that a comparison means something.
The prepared stack is run through the models, which return boundaries, classes and change layers rather than a picture to be interpreted by eye.
Output leaves as a map layer, a table by parcel and a short summary of what changed — formats that drop straight into the systems a customer already runs.
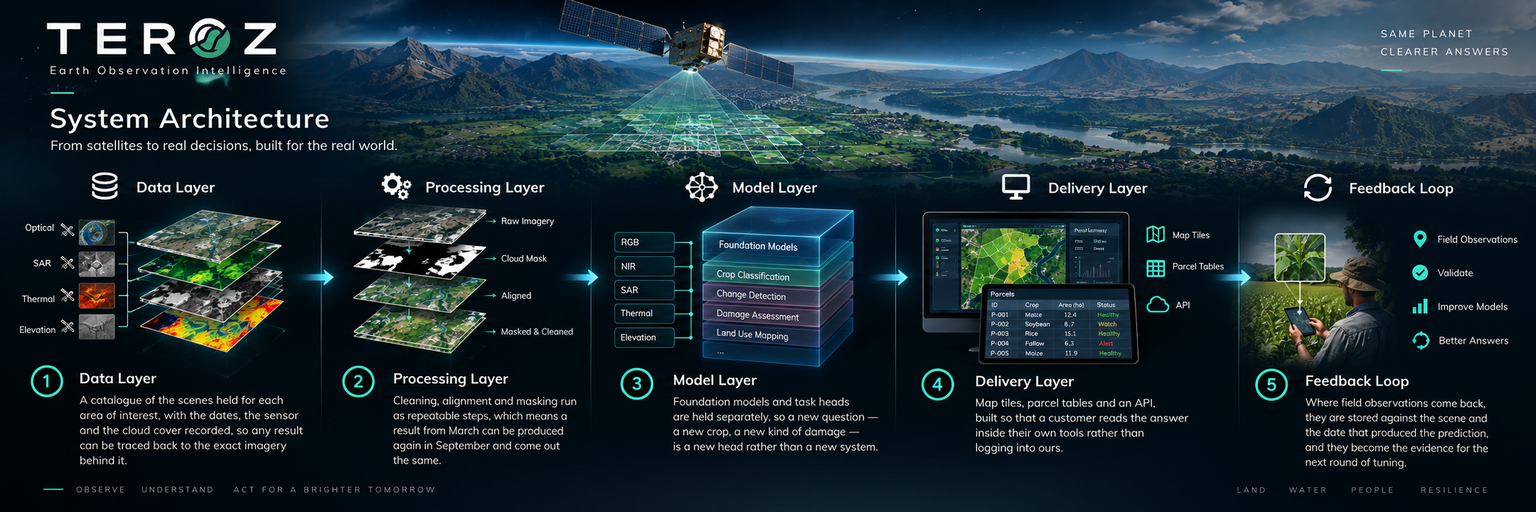
A catalogue of the scenes held for each area of interest, with the dates, the sensor and the cloud cover recorded, so any result can be traced back to the exact imagery behind it.
Cleaning, alignment and masking run as repeatable steps, which means a result from March can be produced again in September and come out the same.
Foundation models and task heads are held separately, so a new question — a new crop, a new kind of damage — is a new head rather than a new system.
Map tiles, parcel tables and an API, built so that a customer reads the answer inside their own tools rather than logging into ours.
Where field observations come back, they are stored against the scene and the date that produced the prediction, and they become the evidence for the next round of tuning.
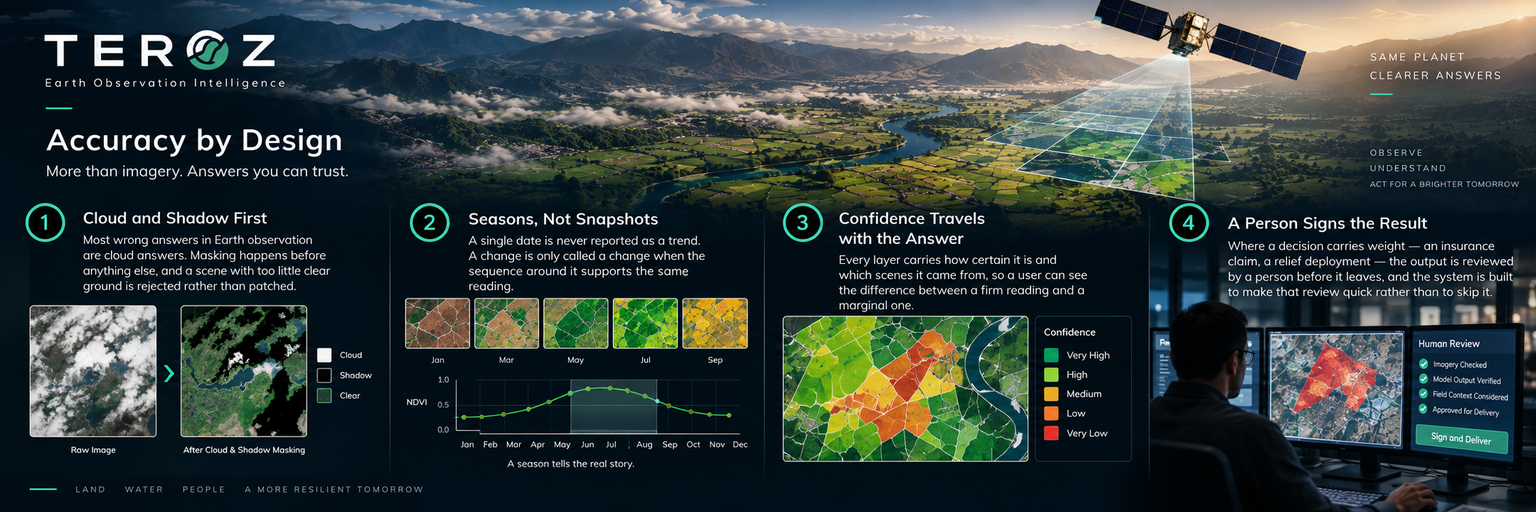
Most wrong answers in Earth observation are cloud answers. Masking happens before anything else, and a scene with too little clear ground is rejected rather than patched.
A single date is never reported as a trend. A change is only called a change when the sequence around it supports the same reading.
Every layer carries how certain it is and which scenes it came from, so a user can see the difference between a firm reading and a marginal one.
Where a decision carries weight — an insurance claim, a relief deployment — the output is reviewed by a person before it leaves, and the system is built to make that review quick rather than to skip it.
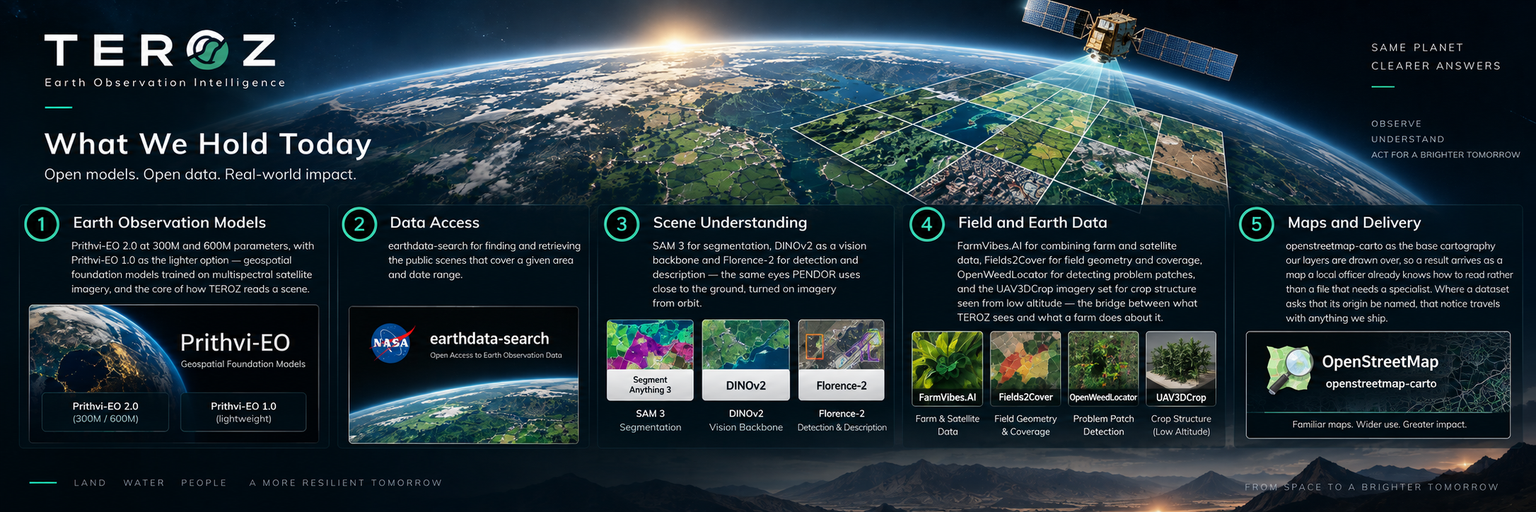
Prithvi-EO 2.0 at 300M and 600M parameters, with Prithvi-EO 1.0 as the lighter option — geospatial foundation models trained on multispectral satellite imagery, and the core of how TEROZ reads a scene.
earthdata-search for finding and retrieving the public scenes that cover a given area and date range.
SAM 3 for segmentation, DINOv2 as a vision backbone and Florence-2 for detection and description — the same eyes PENDOR uses close to the ground, turned on imagery from orbit.
FarmVibes.AI for combining farm and satellite data, Fields2Cover for field geometry and coverage, OpenWeedLocator for detecting problem patches, and the UAV3DCrop imagery set for crop structure seen from low altitude — the bridge between what TEROZ sees and what a farm does about it.
openstreetmap-carto as the base cartography our layers are drawn over, so a result arrives as a map a local officer already knows how to read rather than a file that needs a specialist. Where a dataset asks that its origin be named, that notice travels with anything we ship.
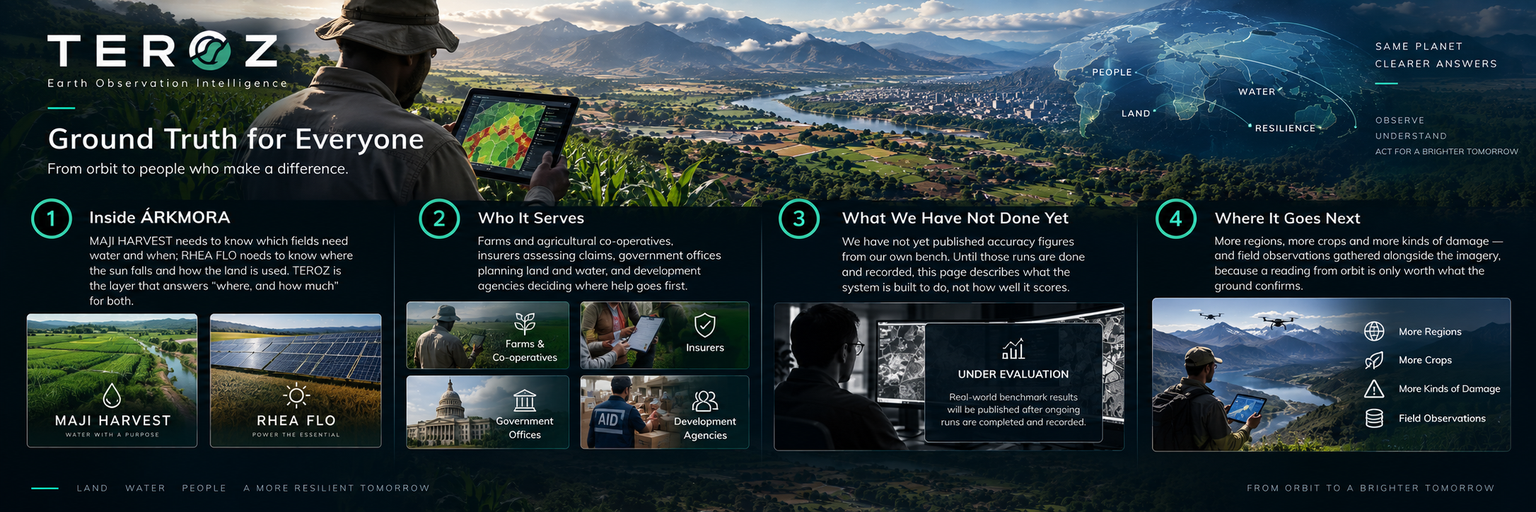
MAJI HARVEST needs to know which fields need water and when; RHEA FLO needs to know where the sun falls and how the land is used. TEROZ is the layer that answers "where, and how much" for both.
Farms and agricultural co-operatives, insurers assessing claims, government offices planning land and water, and development agencies deciding where help goes first.
We have not yet published accuracy figures from our own bench. Until those runs are done and recorded, this page describes what the system is built to do, not how well it scores.
More regions, more crops and more kinds of damage — and field observations gathered alongside the imagery, because a reading from orbit is only worth what the ground confirms.
"A field does not need to be visited to be understood. It needs to be seen, and seen again."
TEROZ — Earth Observation Intelligence.